DISCLAIMER: Image is generated using ChatGPT.
1. What is Grafana?
2. What is Prometheus?
3. Docker Setup
4. Test Environment
5. Datasource
6. Dashboard
What is Grafana?
Grafana is an open-source analytics and visualisation platform. It lets you create dashboards that visualise data from various sources such as:
- Prometheus (metrics and monitoring)
- InfluxDB (time-series data)
- Elasticsearch
- PostgreSQL / MySQL etc.
It’s very popular for monitoring servers, containers, applications especially when paired with Prometheus.
You can find more information here: https://grafana.com
What is Prometheus?
Prometheus is an open-source systems monitoring and alerting toolkit originally built at SoundCloud. It’s now a graduated project of the Cloud Native Computing Foundation (CNCF) which means it’s a mature, production-ready tool used by thousands of companies worldwide.
Prometheus is the metrics collection and storage system that:
- Scrapes metrics from your applications (Perl app, Python app) and infrastructure (node-exporter)
- Stores the metrics in a time-series database
- Provides a query language (PromQL) to analyse the metrics
- Serves the metrics to Grafana for visualisation
Prometheus Server pulls metrics from your applications every 5 seconds (as configured in the prometheus.yml).
You can find more information here: https://prometheus.io
Docker Setup
Docker is the ideal choice for setting up Grafana and Prometheus in one container.
.
├── docker-compose.yml
├── perl-app
│   ├── Dockerfile
│   └── app.pl
├── prometheus.yml
└── python-app
    ├── Dockerfile
    └── app.py
Here we will create two applications one in Perl and another in Python.
File: perl-app/app.pl
#!/usr/bin/env perl

use strict;
use warnings;
use Prometheus::Tiny;
use Mojolicious::Lite;

my $prom = Prometheus::Tiny->new;

$prom->declare(
    'http_requests_total',
    help => 'Total HTTP requests',
    type => 'counter'
);

get '/' => sub {
    my $c = shift;
    $prom->inc('http_requests_total');
    $c->render(text => "Hello from Perl!\n");
};

get '/metrics' => sub {
    my $c = shift;
    $c->render(text => $prom->format, format => 'txt');
};

app->start('daemon', '-l', 'http://*:7000');
File: python-app/app.py
#!/usr/bin/env python

import os
os.environ['PROMETHEUS_DISABLE_CREATED_SERIES'] = '1'

from flask import Flask, Response
from prometheus_client import Counter, generate_latest, CollectorRegistry

app = Flask(__name__)

registry = CollectorRegistry()
http_requests_total = Counter('http_requests_total', 'Total HTTP requests', registry=registry)

@app.route('/')
def hello():
    http_requests_total.inc()
    return "Hello from Python!\n"

@app.route('/metrics')
def metrics():
    return Response(generate_latest(registry), mimetype='text/plain')

if __name__ == '__main__':
    app.run(host='0.0.0.0', port=8000)
It’s now time to create Dockerfile for each of the applications.
File: perl-app/Dockerfile
FROM perl:5.38
RUN cpanm Mojolicious Prometheus::Tiny --notest
WORKDIR /app
COPY app.pl /app/
EXPOSE 7000
CMD ["perl", "app.pl"]
File: python-app/Dockerfile
FROM python:3.11-slim
RUN pip install flask prometheus_client
WORKDIR /app
COPY app.py /app/
EXPOSE 8000
CMD ["python", "app.py"]
Let’s create configuration file for Prometheus.
File: prometheus.yml
global:
  scrape_interval: 5s

scrape_configs:
  - job_name: 'prometheus'
    static_configs:
      - targets: ['prometheus:9090']

  - job_name: 'perl-app'
    static_configs:
      - targets: ['perl-app:7000']

  - job_name: 'python-app'
    static_configs:
      - targets: ['python-app:8000']
Finally create the docker compose configuration file.
File: docker-compose.yml
version: '3'

services:
  grafana:
    image: grafana/grafana
    container_name: grafana
    ports:
      - "3000:3000"
    depends_on:
      - prometheus
    environment:
      - GF_SECURITY_ADMIN_USER=admin
      - GF_SECURITY_ADMIN_PASSWORD=admin
    networks:
      - monitoring

  prometheus:
    image: prom/prometheus
    container_name: prometheus
    volumes:
      - ./prometheus.yml:/etc/prometheus/prometheus.yml
    ports:
      - "9090:9090"
    networks:
      - monitoring

  perl-app:
    build: ./perl-app
    container_name: perl-app
    ports:
      - "7000:7000"
    networks:
      - monitoring

  python-app:
    build: ./python-app
    container_name: python-app
    ports:
      - "8000:8000"
    networks:
      - monitoring

networks:
  monitoring:
    driver: bridge
Start the container now:
$ docker-compose up -d
Creating network "grafana_monitoring" with driver "bridge"
Creating prometheus ... done
Creating python-app ... done
Creating perl-app   ... done
Creating grafana    ... done
Check the status of containers:
$ docker-compose ps
   Name                 Command               State                    Ports
----------------------------------------------------------------------------------------------
grafana      /run.sh                          Up      0.0.0.0:3000->3000/tcp,:::3000->3000/tcp
perl-app     perl app.pl                      Up      0.0.0.0:7000->7000/tcp,:::7000->7000/tcp
prometheus   /bin/prometheus --config.f ...   Up      0.0.0.0:9090->9090/tcp,:::9090->9090/tcp
python-app   python app.py                    Up      0.0.0.0:8000->8000/tcp,:::8000->8000/tcp
Test Environment
Time to test the Perl and Python applications:
$ curl http://localhost:7000
Hello from Perl!
$ curl http://localhost:8000
Hello from Python!
Inspecting the perl app logs:
$ docker-compose logs perl-app
Similarly for python app logs:
$ docker-compose logs python-app
Now fetch the metrics from Perl application:
$ curl http://localhost:7000/metrics
# HELP http_requests_total Total HTTP requests
# TYPE http_requests_total counter
http_requests_total 1
From Python application this time:
$ curl http://localhost:8000/metrics
# HELP http_requests_total Total HTTP requests
# TYPE http_requests_total counter
http_requests_total 1.0
Let’s check all the targets state in Prometheus: http://localhost:9090/targets
You should have all the state UP.

The Grafana should be accessible here: http://localhost:3000/
The default credentials: admin/admin.
Datasource
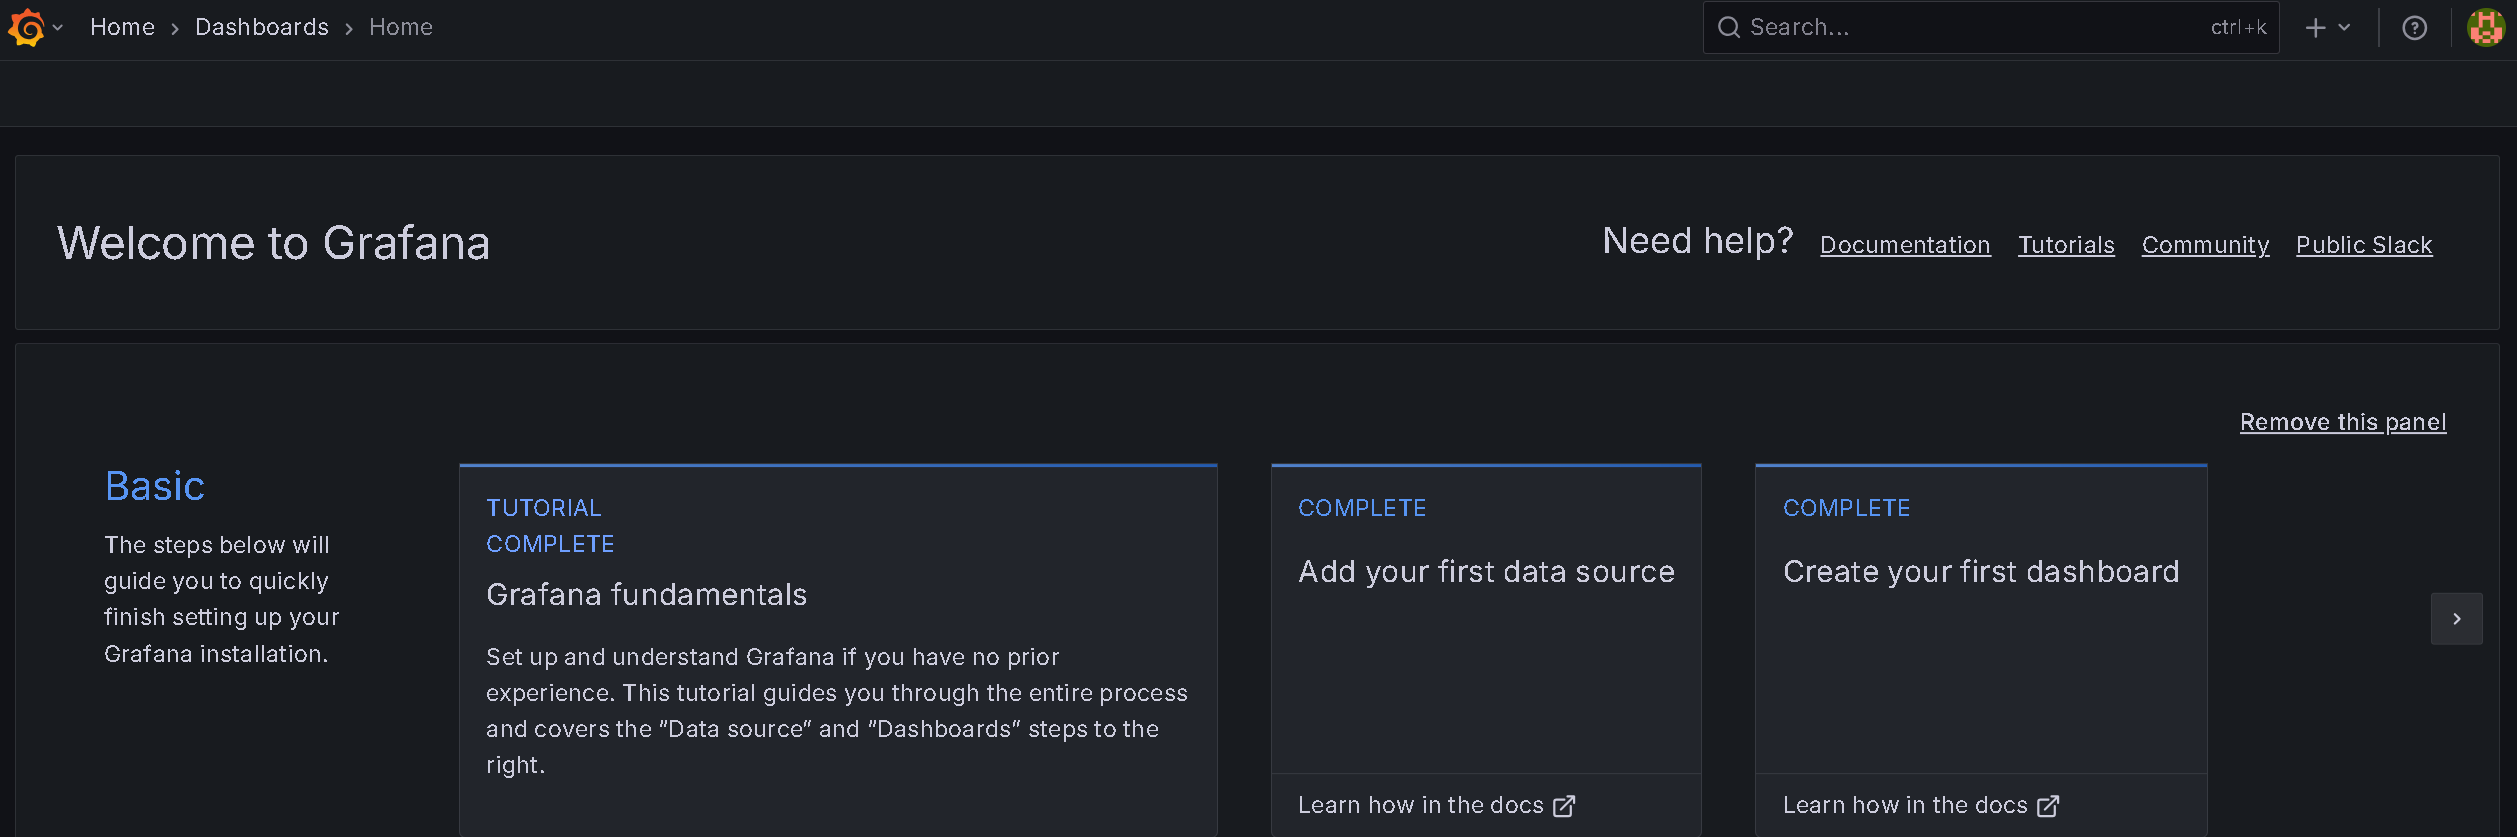
Goto Grafana homepage and click the tile Add your first data source.
You should now see something like below:
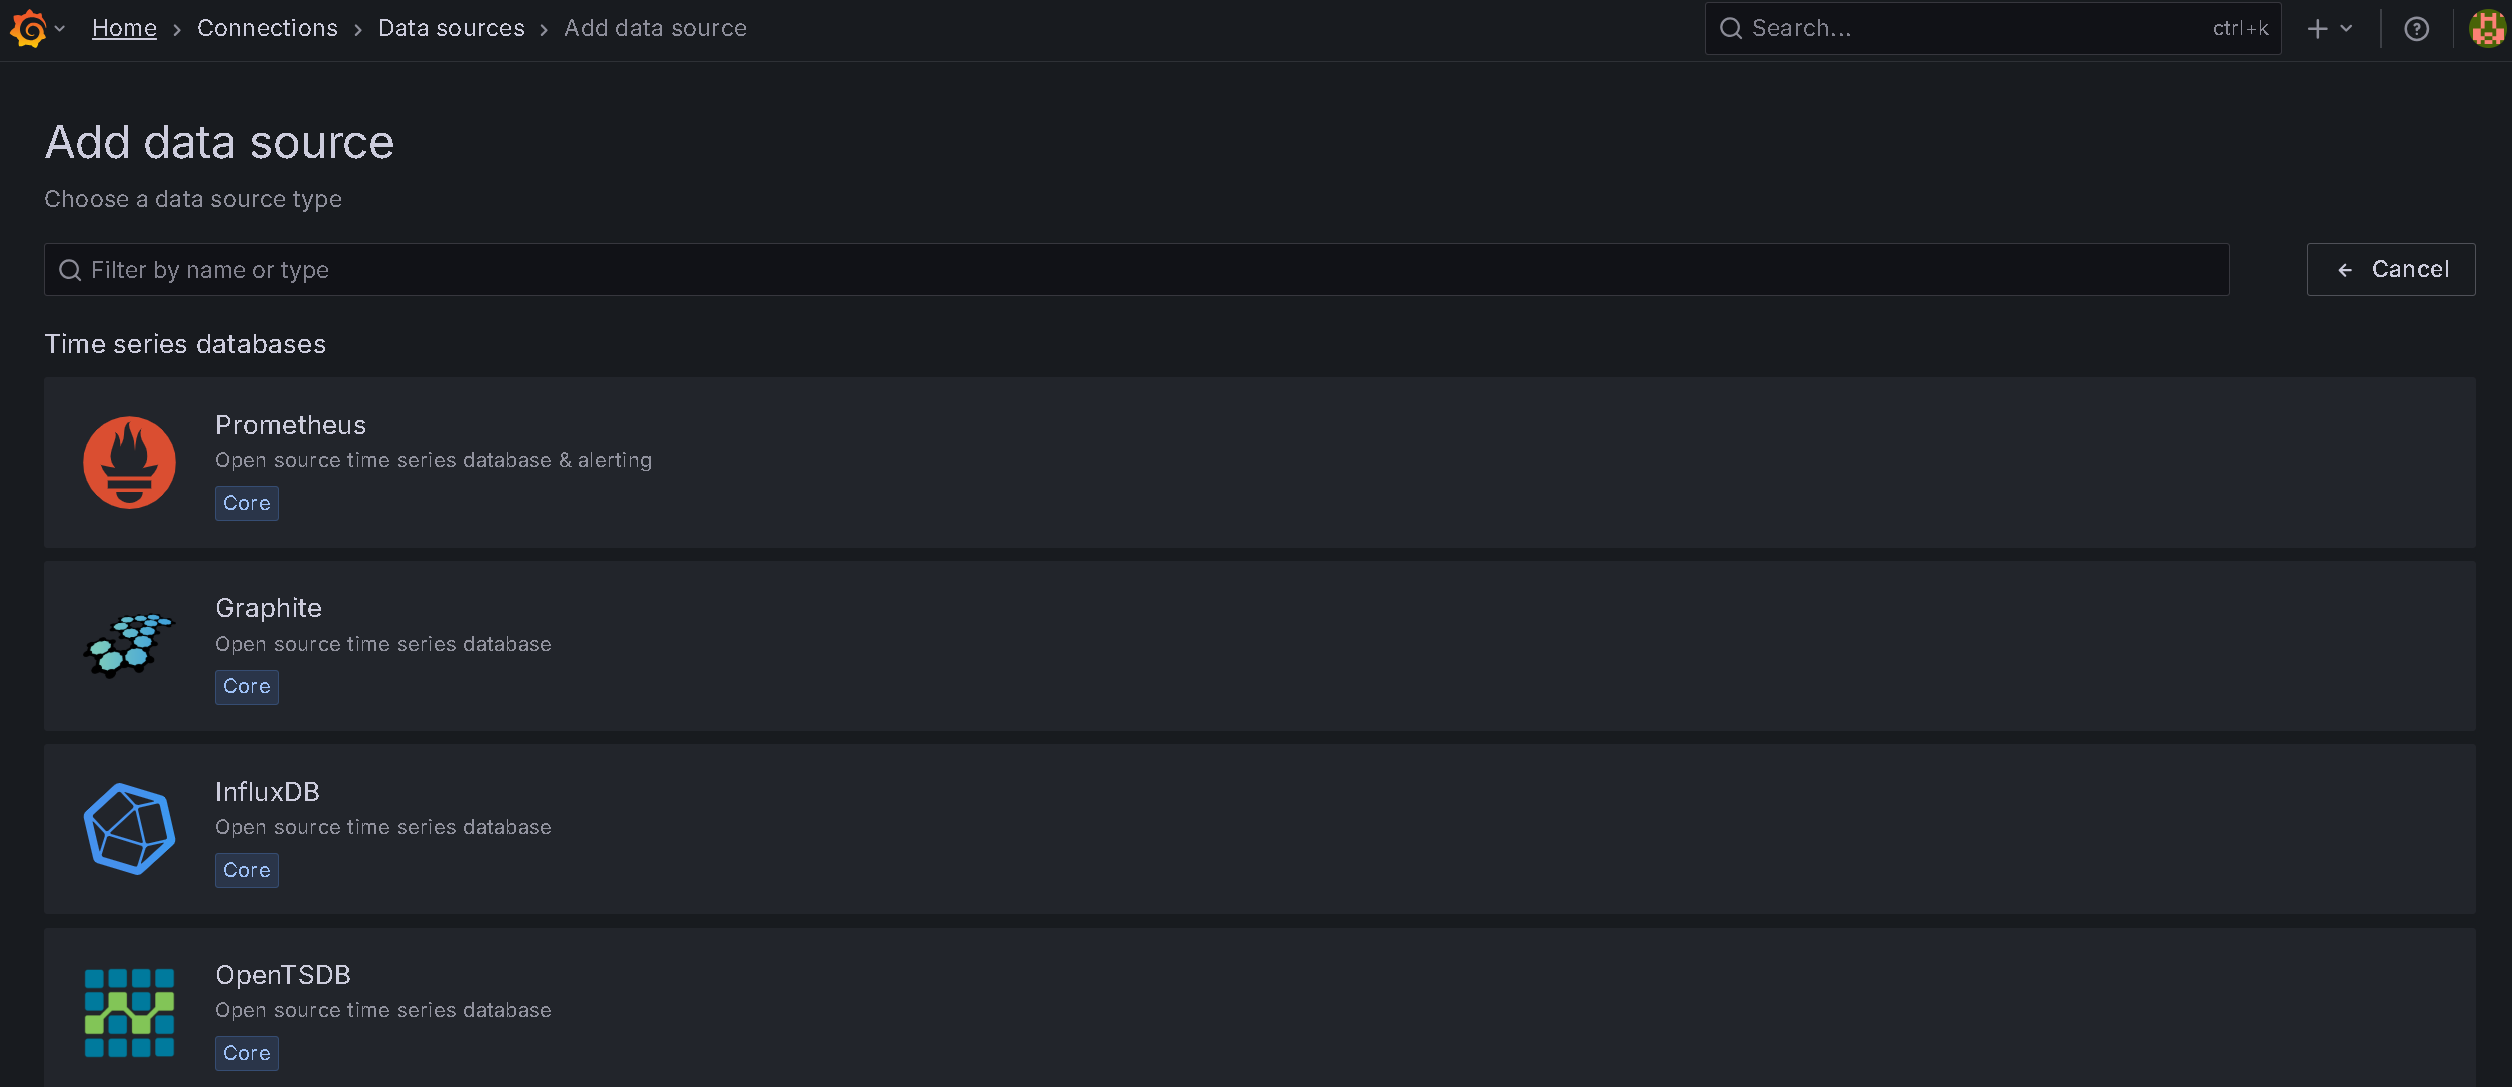
Now select Prometheus from the list and then you should get this:
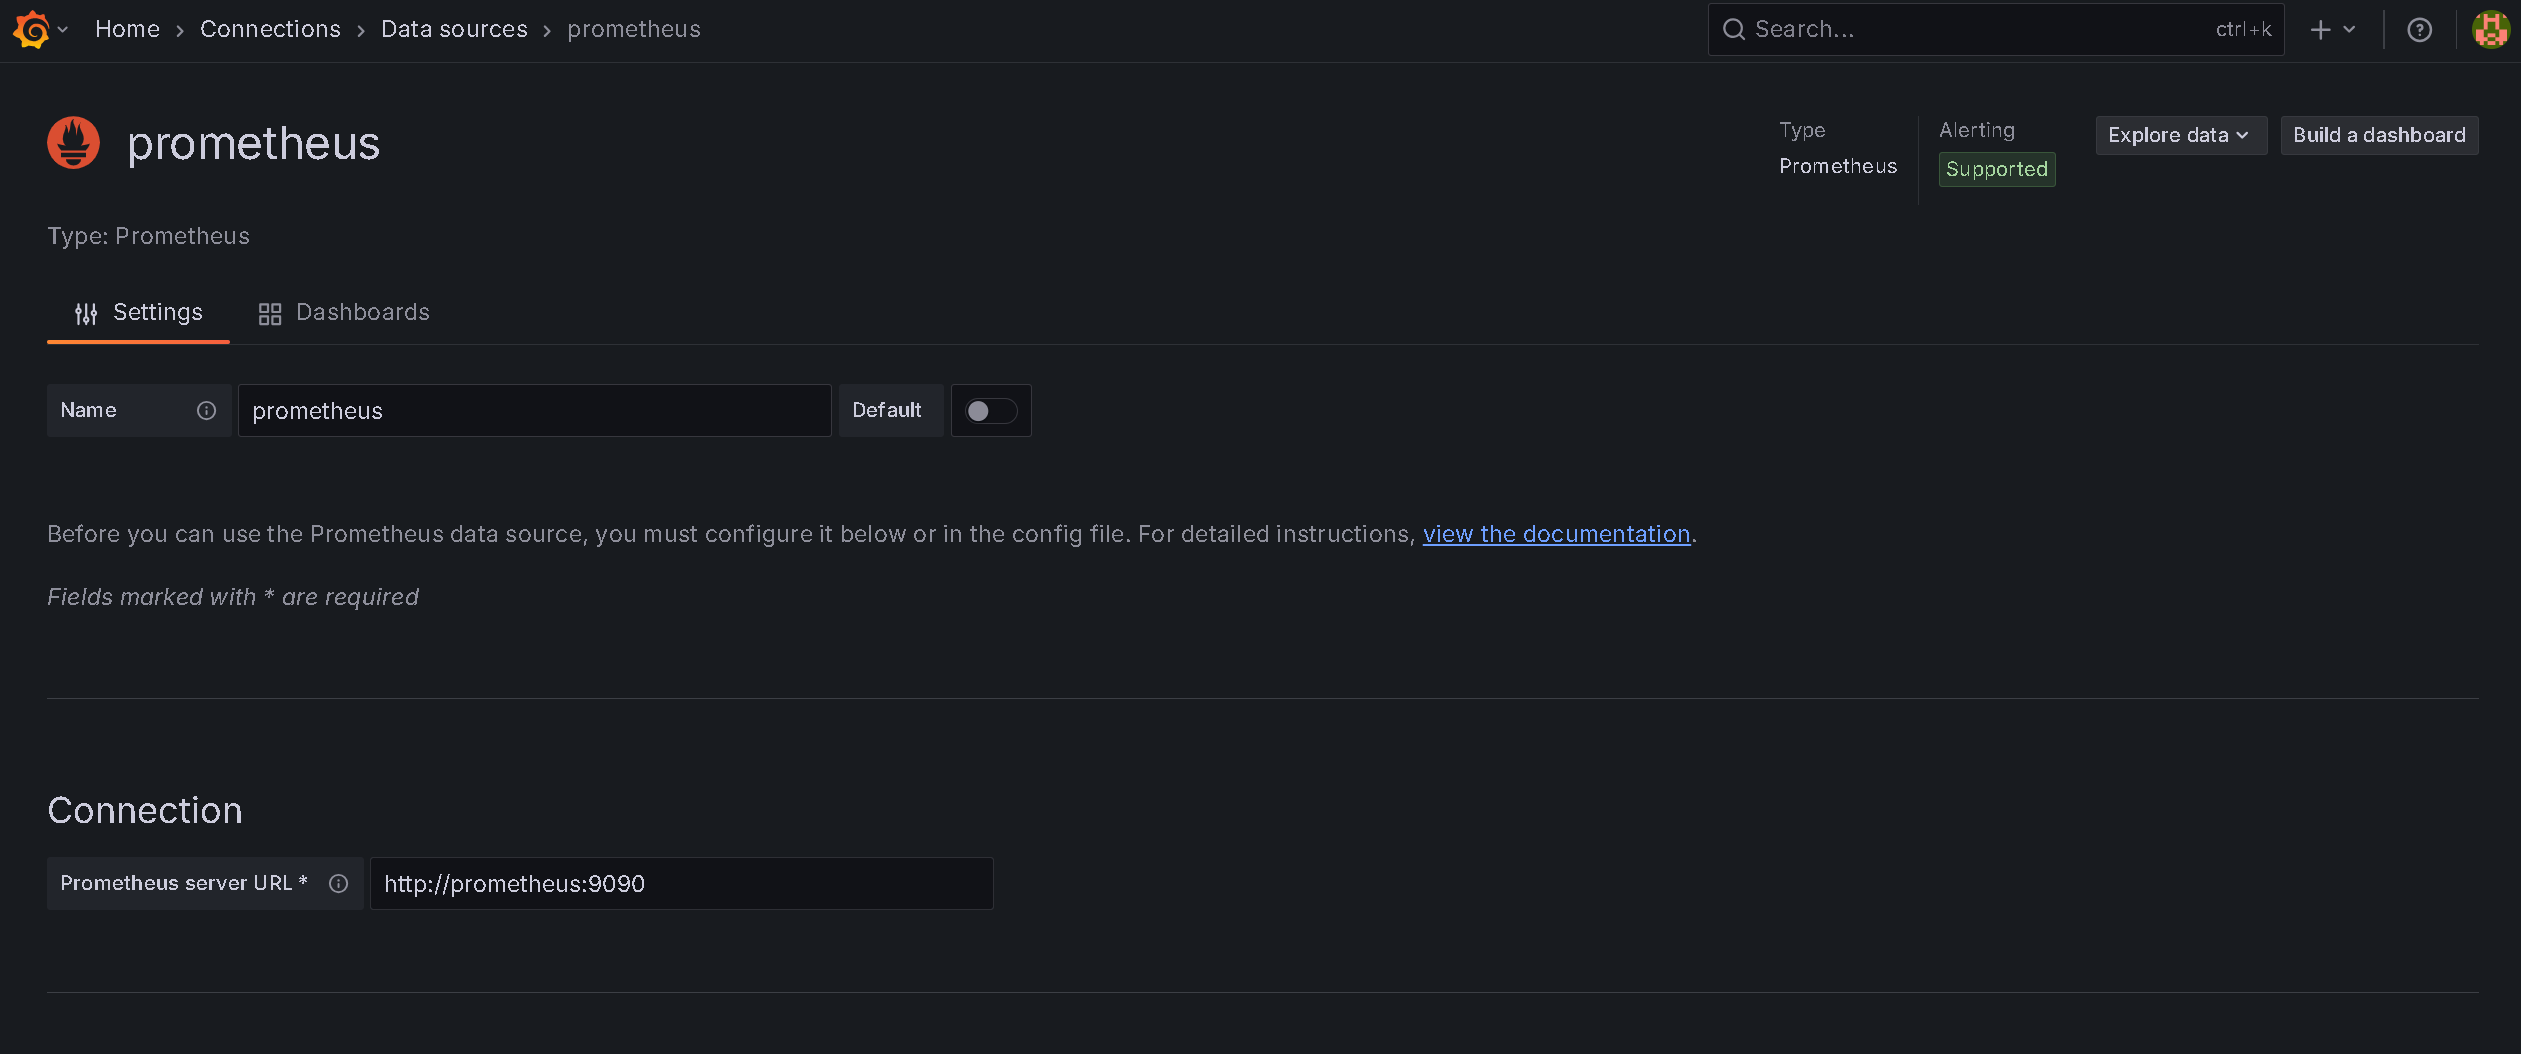
Here, you enter the Prometheus server URL as http://prometheus:9090.
And then click Save & test button.
Dashboard
Go back to Grafana home page and click the tile: Create your first dashboard.
You should have this page now:
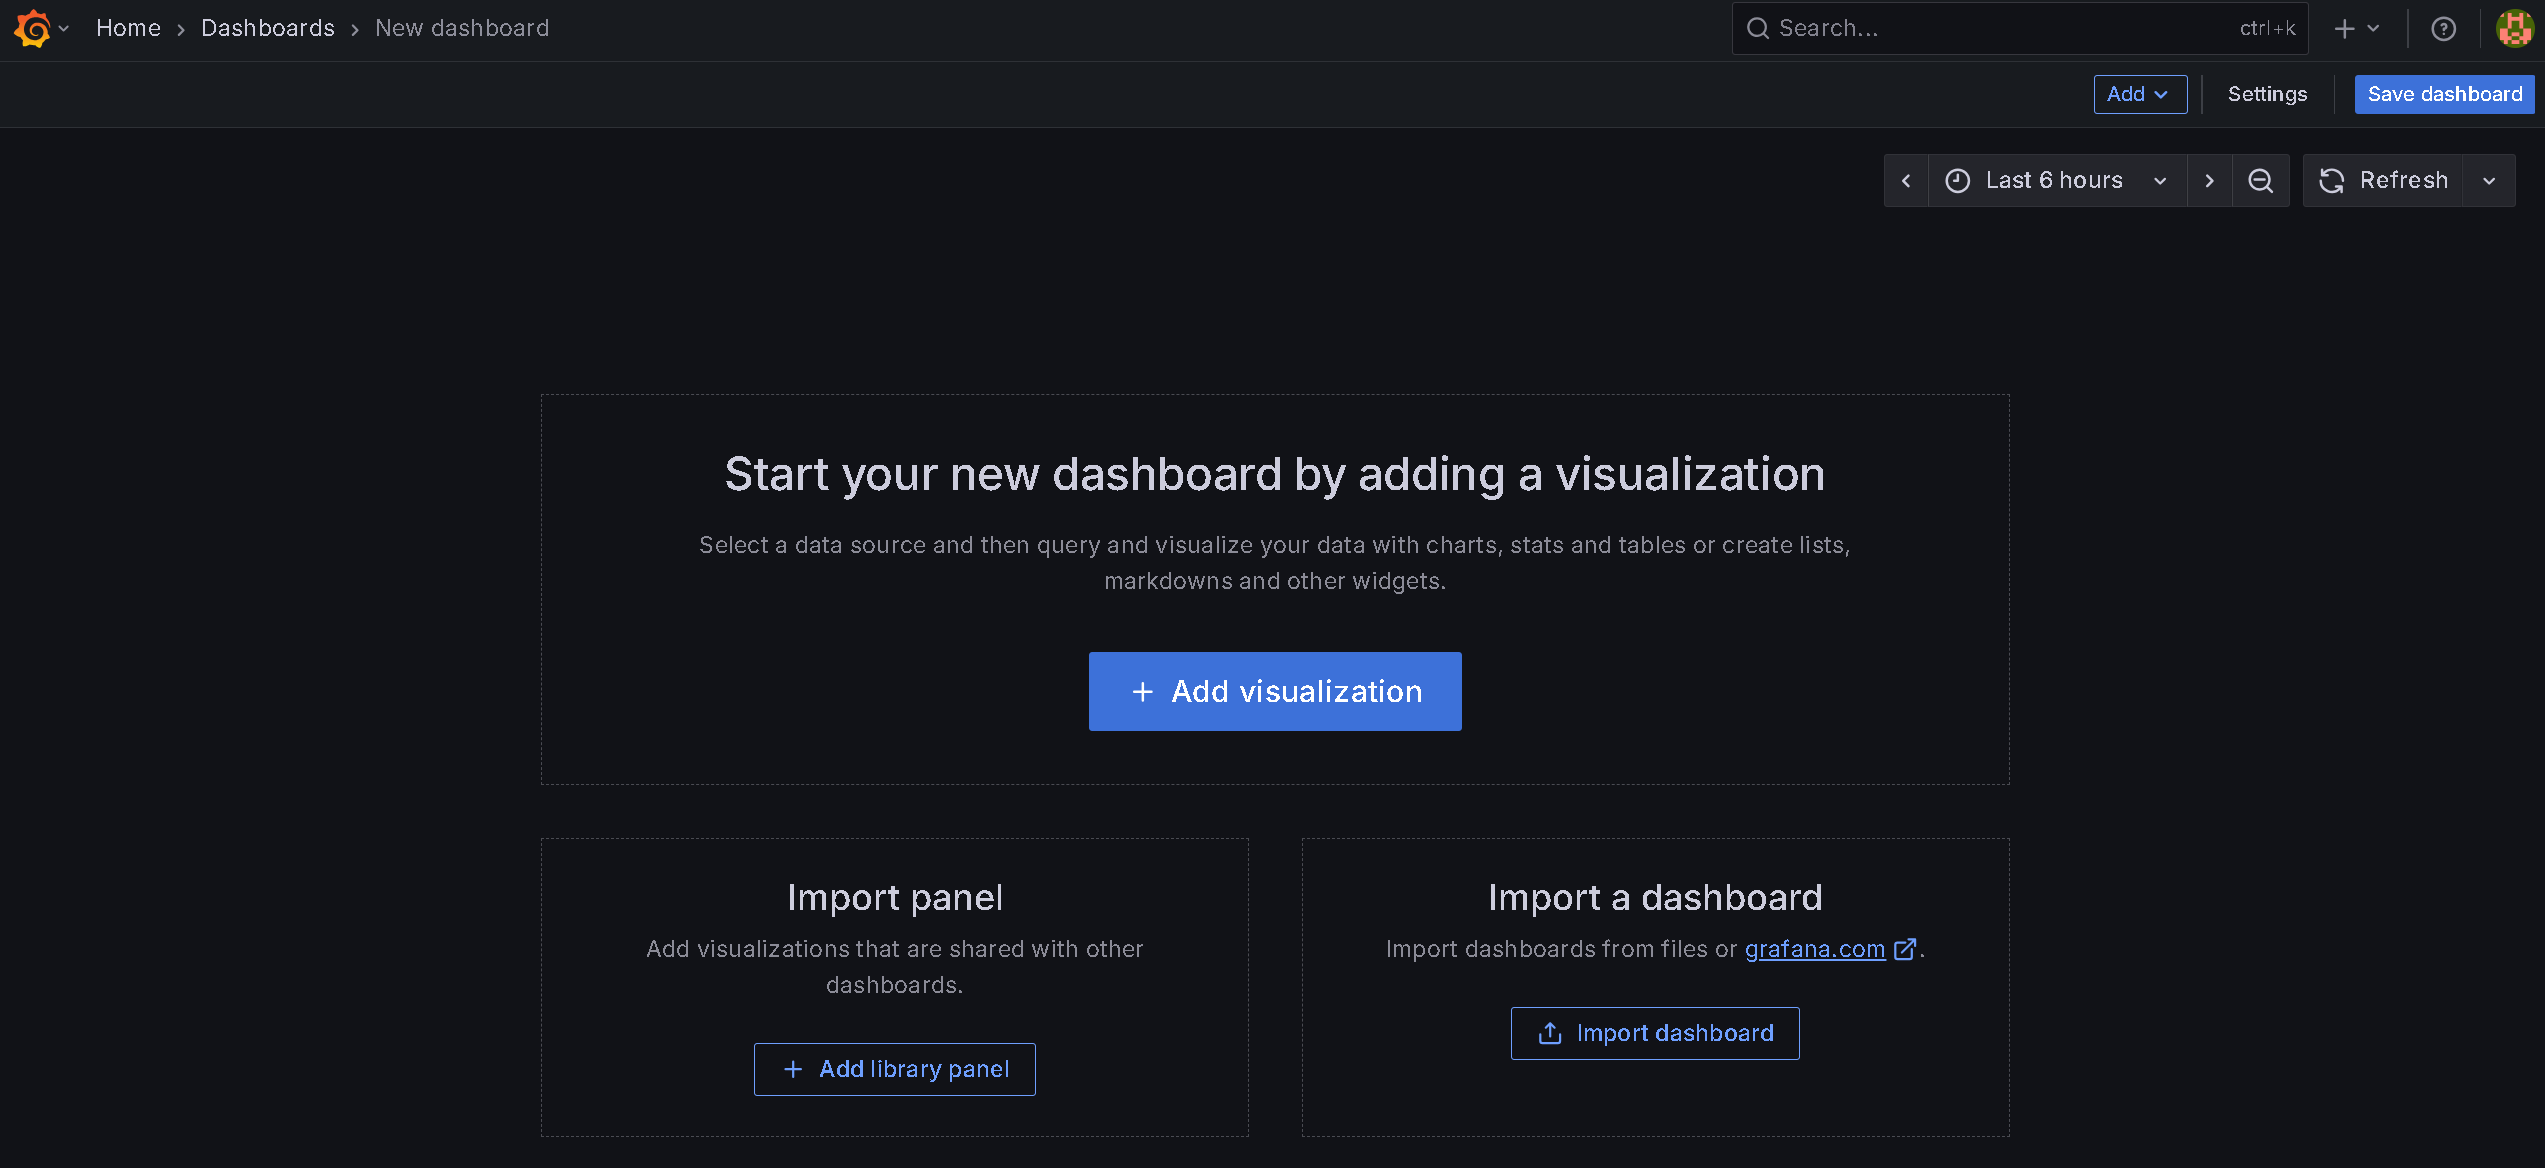
Click the button Add visualisation and you get this page:
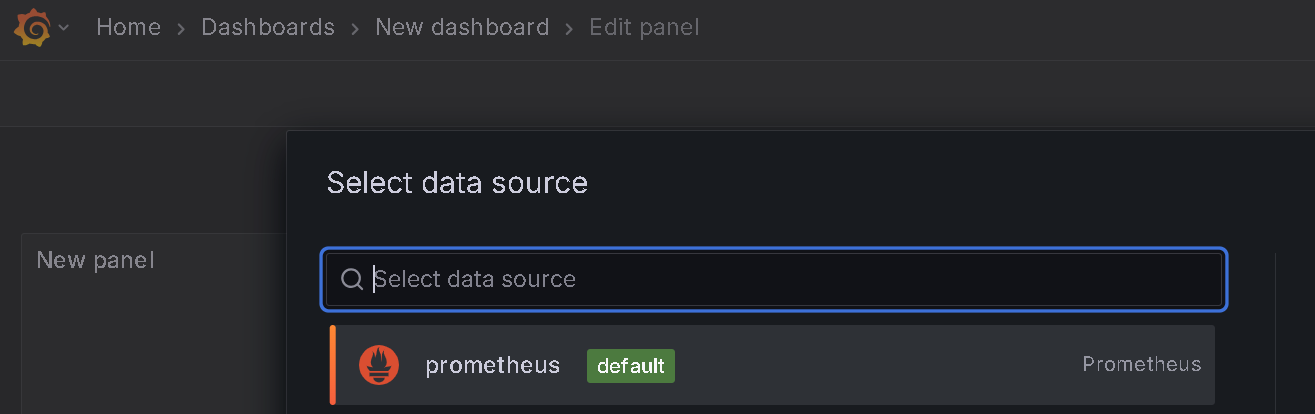
Select the data source: prometheus
You then see this page:

For perl app, we will try this query.
Enter Metrics browser: http_requests_total{job="perl-app"}
Click Run queries
Click Save dashboard
Add another panel for python app similarly.
Enter Metrics browser: http_requests_total{job="python-app"}
Click Run queries
Click Save dashboard
Then you should have this page.

Happy Hacking !!!